What is an FVG? The skipped price zone, and why price often comes back
An FVG (Fair Value Gap) is a stretch of price the market ran through too fast. Spot it with just 3 candles, and understand why price often returns to fill it.
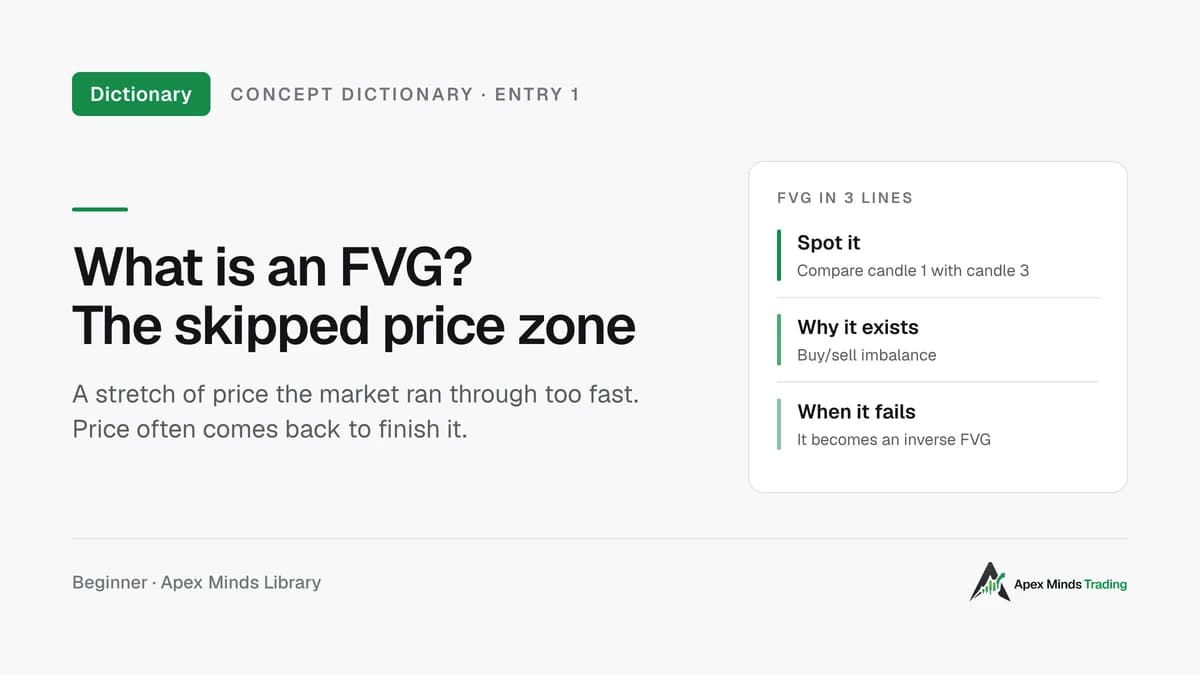
Concept Dictionary · Entry 1 An FVG is a stretch of road price ran through too fast. The market often comes back to finish that stretch.
You keep hearing ICT and SMC traders say "wait for price to come back to the FVG". You open the chart and see nothing but candles, with no idea where the FVG is.
An FVG is easier to spot than you think. All you need is three candles in a row. This article shows you how to spot it, why it appears, why price often comes back, and when it stops working.
What FVG stands for
FVG stands for Fair Value Gap.
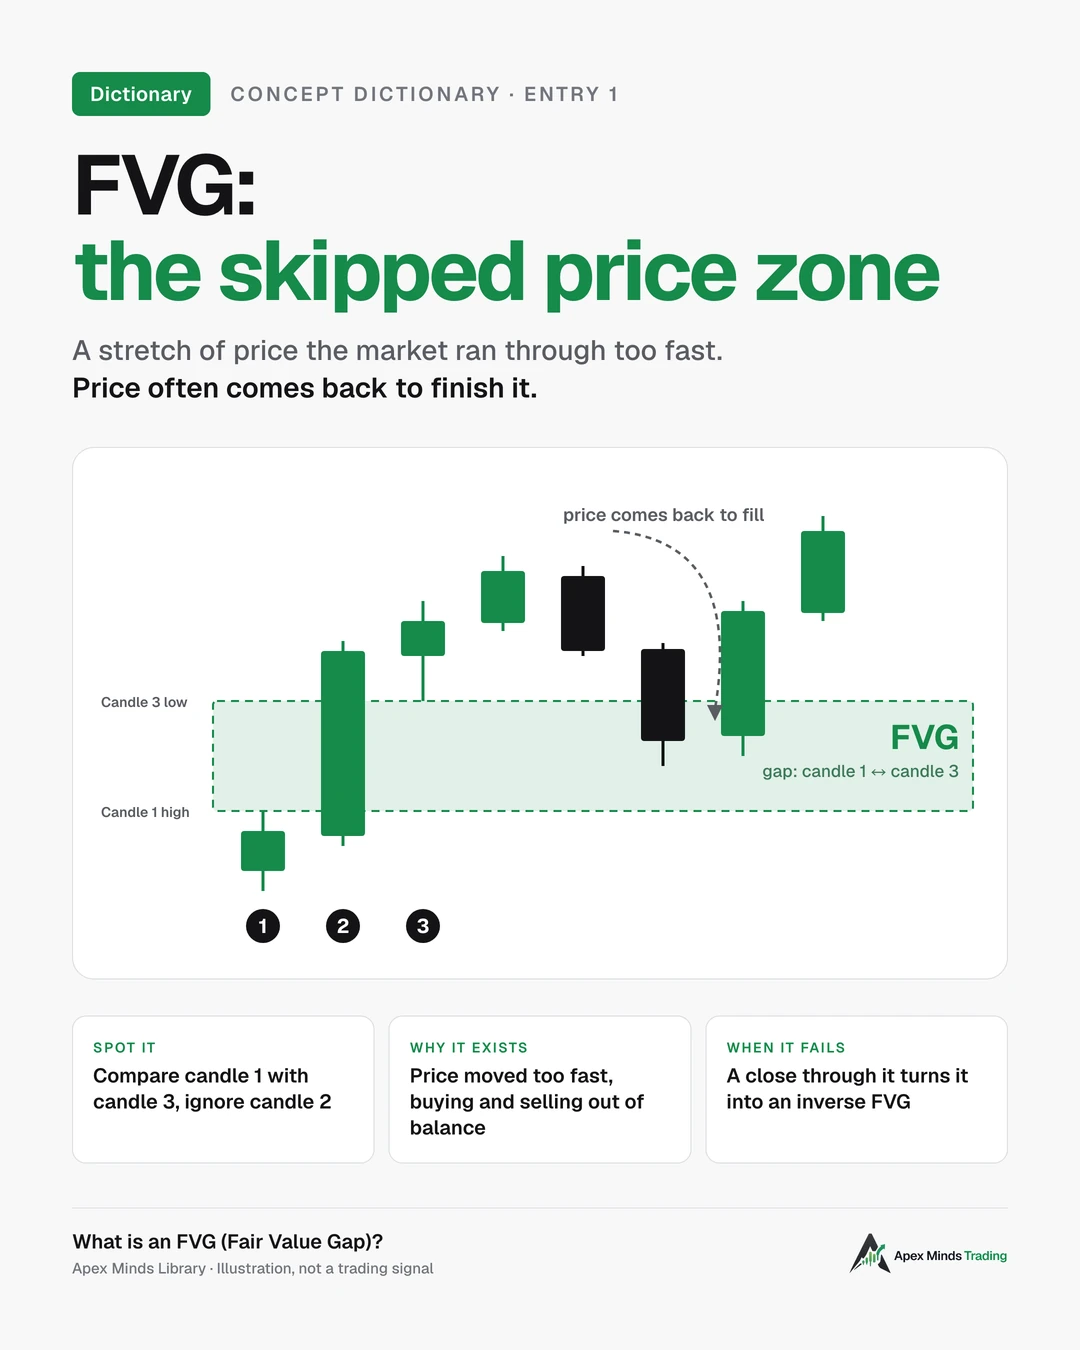
A short definition: an FVG is a three-candle structure with a gap between the high and low of the first candle and the third candle. The gap is still there because price has not come back to that area yet, so it remains open.
We call it the skipped price zone. Price ran straight through it without trading there enough.
Spot an FVG with three candles
There are three steps:
- Find a large candle whose body takes up most of its range.
- Mark the high of the candle just before the large candle.
- Mark the low of the candle just after the large candle.
If those two levels don't touch, the empty space between them is the FVG.
A quick test: drag the high of candle 1 and the low of candle 3 out to the right. If the two lines overlap, even slightly, there is no FVG.
Bullish FVG. Appears when price is rising. The middle candle is a large bullish candle. The gap sits between the high of candle 1 and the low of candle 3.
Bearish FVG. Appears when price is falling. The middle candle is a large bearish candle. The gap sits between the low of candle 1 and the high of candle 3.
Tip: always compare candle 1 with candle 3 and ignore candle 2. Candle 2 is just the push that creates the gap.
Why the gap exists
This is the most important part. Once you understand it, you stop learning FVGs as a shape to memorise.
The SMC book explains it through imbalance. When large institutions place very large orders in a short time, price is pushed too fast. In a strong rally, for example, buy orders lift price so quickly that there aren't enough sellers to fill orders along the way. The result is that price "jumps" over an area with almost no two-way trading.
Picture a car racing down a stretch of road. The car arrives, but nobody has driven that stretch slowly enough to "pave" it. On the chart, that unpaved stretch is the FVG.
Practical ICT Strategies calls an FVG an area of inefficiency: a place where price moved quickly and left a gap.
In ICT, the two types of FVG also have their own names, and the names explain the word "inefficiency":
- A bullish FVG is called BISI (buy side imbalance, sell side inefficiency): in that price range, buying was offered but selling wasn't.
- A bearish FVG is called SIBI (sell side imbalance, buy side inefficiency): selling was offered but buying wasn't.
In other words, that price range has only been traded in one direction. The market hasn't "gone both ways" through it yet.
Why price often comes back to an FVG
Practical ICT Strategies states a principle: price moves for two main reasons. One is to rebalance an imbalance in price delivery. The other is to take liquidity.
An FVG is linked to both.
Reason one, rebalancing. The SMC book describes an FVG as an area where the market has not properly filled buy and sell orders. Price tends to return there to reach "fair value" and correct the imbalance. That is where the name Fair Value Gap comes from.
Reason two, liquidity. Practical ICT Strategies treats an FVG as internal range liquidity. The reason: the highs and lows of the candles that form the FVG are swing points on a lower timeframe. When price comes back to fill the FVG, it also sweeps the liquidity on that lower timeframe.
Put simply: price comes back to the FVG to finish the stretch it skipped, and collects the liquidity sitting there along the way.
What an FVG is used for
Support and resistance. According to Practical ICT Strategies, in an uptrend a bullish FVG can act as strong support: price often retraces to fill the gap before moving higher. In a downtrend, a bearish FVG can act as resistance.
Finding entries. The SMC book suggests waiting for price to return to the FVG to enter, and using the area as an entry or exit point. Once price has filled the gap, there is a good chance it continues in the original direction.
Part of the PD Array. Practical ICT Strategies lists the FVG in the PD Array, a checklist of price areas used to choose entries. The goal of the PD Array is to help you buy at a discount and sell at a premium. When there are several FVGs, the book suggests using the premium and discount tool to pick the best one.
Three levels to mark in an FVG
Once you see an FVG, mark three levels:
- Near edge: where price first touches the FVG on its way back.
- CE (consequent encroachment): the 50% level, in the middle of the FVG. Draw it with Fibonacci from one edge to the other.
- Far edge: where price fills the FVG completely.
When price returns, an FVG that is being respected usually reacts in one of three ways: it touches the near edge and bounces, touches the CE and bounces, or fills completely and forms a new FVG in the original direction. The key signal is the close: as long as no candle closes beyond the CE, the FVG is still being respected. Wicks can stab deep, but the close is what you judge by.
Enter at the edge or at the CE? Waiting at the CE means a tighter stop and smaller risk, but sometimes price only tags the edge and runs, and you miss the trade. If the FVG is too wide, you can narrow the entry by looking left for an Order Block that lines up with the FVG, or by dropping to a lower timeframe to find a small FVG inside the larger one.
When an FVG stops working
Both books use words like often and tends to. Neither says price always comes back, and neither says price is certain to bounce from an FVG.
There are two warning levels:
- A candle closes beyond the CE: the first sign price is no longer respecting the FVG.
- A candle closes fully through the FVG: the FVG has failed.
Practical ICT Strategies calls an FVG that has been broken an inverse FVG. It is the earliest signal that momentum is shifting, which can lead to a short retracement or a change in direction later.
Interestingly, the old FVG switches roles. A bearish FVG that price closes above can act as support when price comes back. A bullish FVG that price closes below can act as resistance. The retest doesn't have to happen right away; sometimes it comes after a period of consolidation.
So an FVG is an area worth watching, not a trade on its own. How Apex applies it:
- Only pay attention to FVGs in the direction of the main trend.
- Prefer bullish FVGs in the discount zone and bearish FVGs in the premium zone.
- Always have a stop loss beyond the FVG. If price closes through it, accept that the FVG has failed.
Don't confuse an FVG with a volume imbalance or a gap
These three are often all called "gaps", but they are different:
- FVG: a gap between the wick of candle 1 and the wick of candle 3, seen across three candles.
- Volume imbalance: the close of one candle and the open of the next are different, but the wicks still overlap. Price did trade through that area; the bodies just aren't continuous.
- Gap: no trading at all between two candles, often seen when the market opens at the start of the week.
A gold example (illustration)
Suppose XAU/USD is rising on the M15 chart:
- Candle 1 has a high at 3,350.
- Candle 2 is a bullish candle with a very long body.
- Candle 3 has a low at 3,356.
The high of candle 1 (3,350) and the low of candle 3 (3,356) don't touch. The 3,350–3,356 zone is a bullish FVG. The near edge is 3,356, the CE is 3,353, and the far edge is 3,350.
A few hours later, if price pulls back into this zone, that is where ICT traders look for a buy. A candle closing below 3,353 is a warning. If price closes firmly below 3,350, the FVG has failed and may become an inverse FVG, meaning the 3,350–3,356 zone could later act as resistance.
These figures are for illustration only and are not trading signals.
In short
- An FVG (Fair Value Gap) is the gap between candle 1 and candle 3, created by an overly strong candle 2.
- It appears because of imbalance: price moved too fast and buy and sell orders were not fully matched.
- Price often returns to the FVG to rebalance and take lower-timeframe liquidity.
- FVGs are used as support, resistance and entry areas, and belong to the PD Array.
- Mark three levels: near edge, CE (50%), far edge. A close beyond the CE is a warning.
- When price closes through it, the FVG becomes an inverse FVG, signalling a shift in momentum.
Related concepts in the Dictionary
- Imbalance: the root cause of an FVG.
- SIBI and BISI: the names for bearish and bullish FVGs.
- CE (consequent encroachment): the 50% level of an FVG.
- Volume imbalance and gap: two kinds of gaps easily confused with an FVG.
- Inverse FVG: when an FVG is broken.
- Implied FVG: an FVG with no visible gap because the wicks overlap.
- Balanced Price Range (BPR): where two opposite FVGs overlap.
- PD Array, Premium and Discount: the checklist of entry areas and how to split price into cheap and expensive zones.
- Order Block: another PD Array that often appears alongside an FVG.
- Liquidity, internal and external range liquidity: what price is seeking.
- Market Structure Shift (MSS): a sign that structure has changed direction. After an MSS, ICT traders often look for an FVG to enter.
References
- ICT video lectures in Apex's reference library (FVG, inverse FVG, refining entries within an FVG).
Trading forex, gold and leveraged products carries a high level of risk and you can lose your capital. This article is for educational purposes only, is not investment advice and does not promise profits. All figures in the article are illustrations.
