Order Blocks with FVGs: how to filter valuable OBs on H1 and H4 when trading gold
An Order Block is the launch pad, the FVG is the mark of the jump. How to spot a real OB, why an OB with an FVG is more reliable, and a filter for OBs on H1/H4 for day trading gold.
Concept Dictionary · Entry 2
Open a gold H1 chart and almost any down candle before a rally could be called an "Order Block". Mark them all and the chart fills with boxes, and you can't tell which ones to trust.
This article helps you do three things: understand what an Order Block is and why it forms, see why an OB paired with an FVG is more reliable than an OB on its own, and get a concrete set of criteria to filter OBs on H1 and H4 when day trading gold.
What this article is built on. It combines a practical ICT book, ICT video lectures, SMC material and educational material from developers of analysis tools, cross-checked and distilled into a set of rules you can use on a chart. It separates three layers: what all sources agree on, where each source defines things differently, and how this article resolves those differences. Anything that couldn't be verified from the original source is flagged where it appears.
If you haven't yet, read What is an FVG first, as this article builds on it.
What is an Order Block
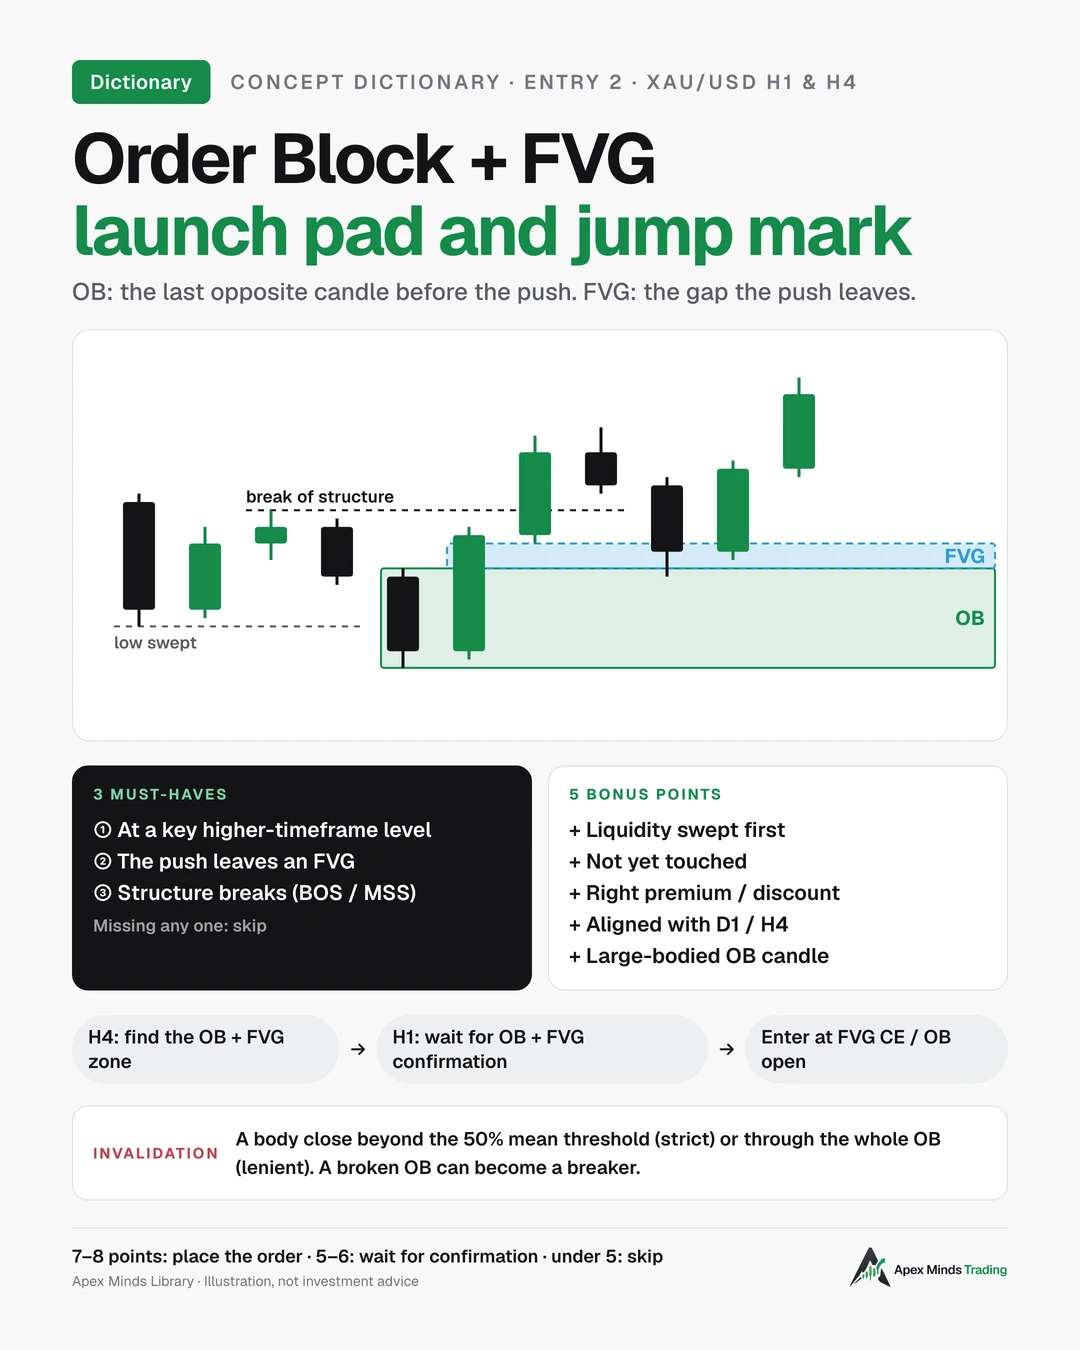
An Order Block (OB) is a price area from which the market launched a very strong move.
The practical ICT book defines:
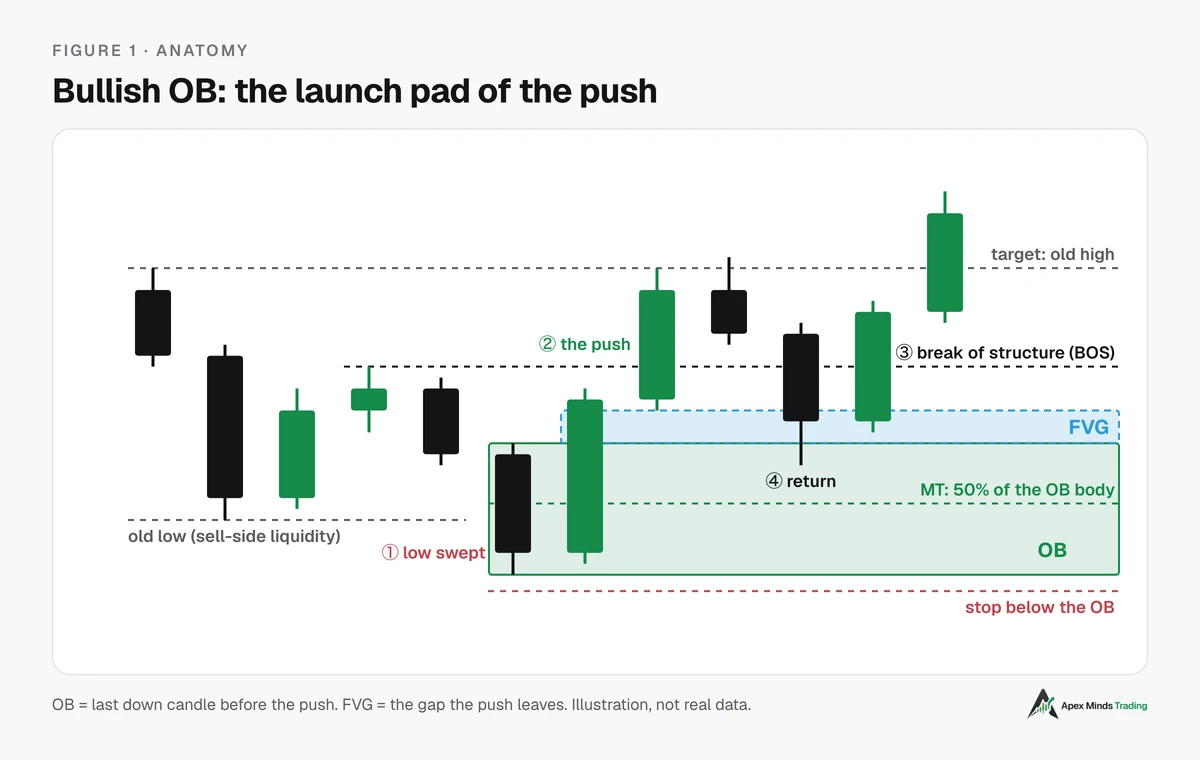
- A bullish OB is the last down candle before a strong, sudden rally.
- A bearish OB is the last up candle before a strong decline.
The book also notes that, in a 2024 lecture by the founder of the ICT method, the whole run of consecutive same-colour candles before the push can be taken as the OB. Within that run, the last candle is the most sensitive and the preferred one.
Apex calls the OB the launch pad. If the FVG is the jump mark the push leaves behind, the OB is where the push started.
Why OBs form
SMC material describes an OB as an area where large institutions such as banks place buy or sell orders, so liquidity is concentrated there. The common explanation in SMC circles goes like this:
- An institution wants to buy a very large amount. It can't buy it all at once without pushing price up too fast.
- It accumulates orders within a price area, often right after price sweeps an old low, where many other traders' stop losses provide the other side of the trade.
- Once it has enough, price is driven away hard and leaves an FVG.
- Some orders may remain unfilled, so when price comes back to that area, the market often reacts.
You should know this is an explanation, not a verified fact. Nobody sees the institutions' real order books. What traders can verify is price behaviour: does that area usually hold when price returns? That's why the OB filter below is based only on what you can see on the chart.
Spotting a real OB
A real OB needs three things. Without any one of them, it's just an ordinary candle.
1. A strong push away from the zone (displacement). Displacement means price moves forcefully, with long-bodied candles, in one go. SMC educational material puts it bluntly: no displacement, no order block, whatever the candle looks like.
2. Price closes beyond the opposite candle.
- The practical ICT book requires that, for a bullish OB, the next up candle takes out the low of the down candle and then closes above its high, fully engulfing it.
- The ICT video lectures Apex refers to use a simpler marker: once price closes beyond the opening price of the opposite candle (or run of candles), the OB is confirmed.
3. The OB sits at a key level. The video lectures stress that the same candle pattern appearing at a random spot on the chart means nothing and is not an order block. An OB must form at a higher-timeframe zone, such as a higher-timeframe FVG, an older OB, or a high or low with liquidity.
How to mark the OB zone
Three ways to mark it, used for three different jobs. None replaces the others.
- Full zone (candle high to low, including wicks): for scoring and for checking whether the OB is still valid or has been broken.
- Tight zone (body only): for entries and tighter stops.
- Mean threshold (MT), the 50% level of the OB candle's body: a confirmation marker.
According to the video lectures, when price returns to an OB that is being respected, no candle body closes beyond the MT, even if wicks poke into it.
Two kinds of imbalance in and around the OB
This is the easiest place to get confused, and if you get it wrong here the filter below will score incorrectly.
- The push's FVG: the gap between the OB candle and the third candle, sitting outside the OB zone. This is evidence of the push, and it's what criterion 3 below refers to.
- Imbalance inside the OB: a lower-timeframe imbalance sitting right on the OB candle's body. The practical ICT book uses it as a separate validity condition.
An OB can have the second without the first. But an OB without the push's FVG is a weak OB, because nothing suggests large orders were there.
Where sources define things differently
This is where beginners get confused, because each source marks OBs a little differently:
- The practical ICT book: the OB is the last opposite candle. Validity: the next candle sweeps its low (or high) and engulfs it, there is a lower-timeframe imbalance in the OB zone, and lower-timeframe structure shifts.
- The ICT video lectures Apex refers to: confirmation is a close beyond the opening price of the opposite candle. A liquidity sweep beforehand is preferred, not required. One older lecture (2023) required both a sweep and a break of structure, so even a single author changes criteria over time.
- SMC material: divides OBs into seven types, including the extreme OB (at the extreme of the move), the propulsion block, the breaker block and the mitigation block. This classification is much broader than the ICT book's.
- Educational material and automated indicators: educational material from analysis-tool developers uses a definition close to ICT's (last opposite candle, displacement and break of structure required). But automated indicators often use different mechanical rules, for example based on swing points or volume peaks. So an indicator may mark a different zone than you would by hand. Don't be surprised if its OB box doesn't match yours.
- Some summaries of early ICT lectures (2016–2017) describe a bullish OB as the lowest down candle near support, with the longest body. That's narrower than "the last down candle". Apex could only read this through secondary sources and has not verified the original.
What all sources share: an OB must be tied to a strong push that changes structure. As for the FVG, the liquidity sweep, premium/discount location and higher-timeframe alignment, some sources treat them as required and others as bonus points. This article treats them as scoring criteria.
Why an OB with an FVG is more reliable
The FVG is evidence of the push. A push strong enough to leave a gap between candle 1 and candle 3 is a genuinely imbalanced push. Put simply: the gap is the imbalance inside the move, and the order block is the candle the move launched from.
The two zones sitting next to each other create a clear entry area. For a bullish OB, the FVG sits just above the OB. When price pulls back down, it enters the FVG first, then reaches the OB. You have three entry options, in the order price reaches them:
- Top edge of the FVG. Fills first and most easily, but carries the largest risk.
- CE of the FVG (its 50% level) or the OB's opening price. A balance between fill probability and risk.
- The OB's MT. Fills last, shortest stop, but you may miss the trade.
For a bearish OB, read it in mirror image: the FVG sits below the OB. As price pulls back up, it touches the bottom edge of the FVG first, then the FVG's CE, and only then the OB. So the MT of a bearish OB is also the latest-filling entry with the shortest stop.
The ICT video lectures also use a way to narrow the entry: when a higher-timeframe FVG is too wide, look left for an OB that lines up with the FVG and use that OB's opening price as the entry.
Filtering valuable OBs on H1 and H4
Day trading gold leaves no time to trade every OB. Here are 8 criteria. Each one met earns 1 point.
- At a key higher-timeframe level. For example, an H1 OB inside an H4 FVG, an H4 OB, or right at an old D1 high or low.
- Liquidity swept before the turn. Price runs through an old high or low, equal highs or equal lows, and only then reverses.
- The push leaves an FVG. This is the push's FVG, outside the OB zone, not the imbalance inside the OB.
- Structure breaks. The push closes beyond the nearest high (for a bullish OB) or the nearest low (for a bearish OB). The usual terms are BOS (break of structure) or MSS (market structure shift).
- Not yet touched (unmitigated). Count it as touched when a candle closes inside the OB zone. A wick that pokes in and pulls back still counts as untouched. An OB touched many times may already have had its orders filled.
- Right price zone. A bullish OB sits in discount (the lower half of the higher-timeframe range), a bearish OB in premium (the upper half). Use the nearest range that still matters: the high and low of the current leg, or the previous day's range for gold. Drop ranges older than two structures. The practical ICT book uses a Fibonacci from the old high to the old low, with the 0.5 level splitting the two zones.
- Aligned with the higher timeframe. If D1 and H4 are rising, favour bullish OBs on H1.
- A clear OB candle. The video lectures call a large-bodied, small-wicked candle a high-probability OB. A long-wicked candle is a low-probability OB, only worth using in a clear trend.
How to use the score (this is Apex's rule of thumb, not a theorem):
- 7–8 points: a high-quality OB; a pending order is reasonable.
- 5–6 points: only enter with confirmation on a lower timeframe.
- Under 5 points: skip.
Treat criteria 1, 3 and 4 as mandatory. If any of the three is missing, skip the OB even if the total score is high.
The score is not a reason to increase your size. R is your unit of risk, the amount you accept to lose if the trade is wrong. An 8-point OB should still be traded at a fixed risk, for example 1% of the account. A higher score raises the expected win rate; it does not raise the amount you're allowed to lose.
Signs of a weak OB
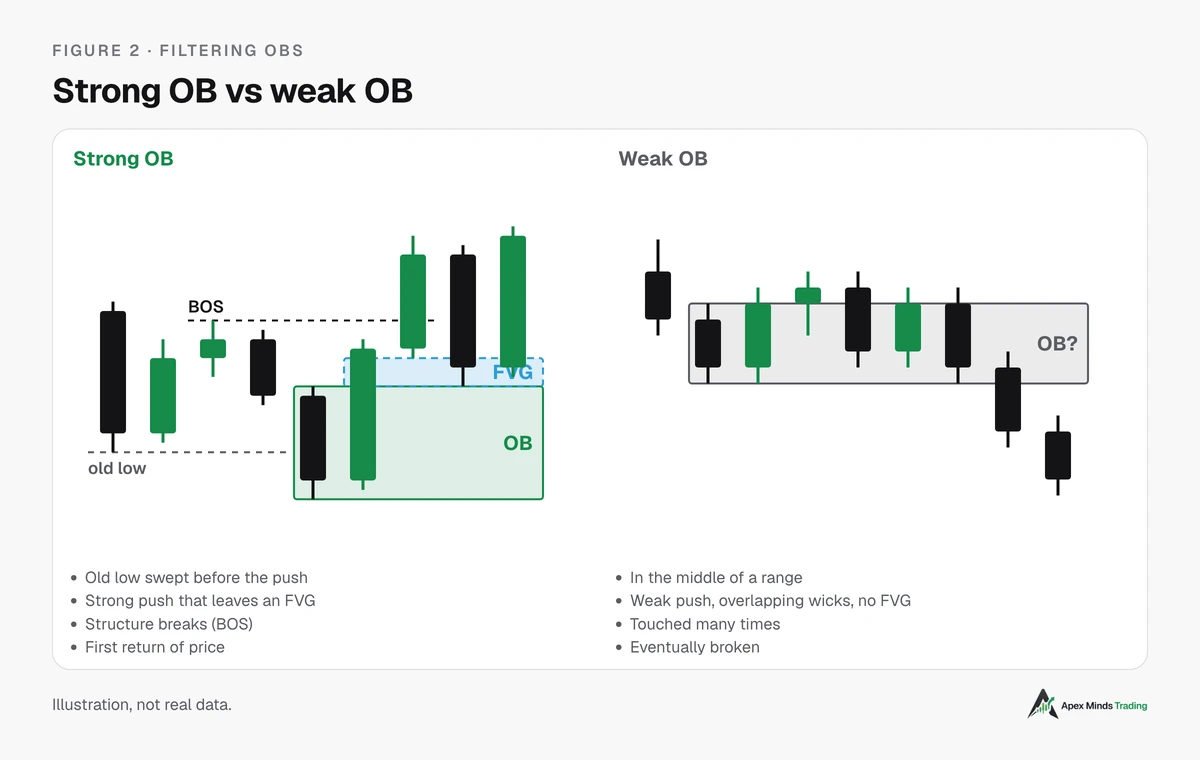
- It sits in the middle of a range, not tied to any key level.
- The push is gentle, wicks overlap, no FVG.
- It has already been touched two or three times.
- It goes against the higher-timeframe trend.
- The candle is small with long wicks.
- It formed during thin-liquidity hours. Gold spreads often widen around the New York close and the start of the Asian session, so OBs formed then are easily pierced by wicks and recover without real force behind them.
When an OB stops being valid
Sources disagree. There are three markers to consider:
- Strict (ICT video lectures): a body close beyond the MT means the OB has weakened.
- Lenient (SMC educational material): it takes a close through the whole OB zone.
- Time (Apex's experience): an OB that goes untouched for many days loses value, because the structure around it has changed. There's no absolute number, but an H4 OB nobody has touched for three or four days shouldn't be your only reason to enter.
Either way, a broken OB can flip roles and become a breaker block, a barrier in the opposite direction.
How H4 and H1 work together when day trading
- H4 gives you the zone. Find an OB + FVG on H4 in the right premium or discount zone, aligned with D1. That's where you wait.
- H1 gives you confirmation. When price enters the H4 zone, drop to H1 and wait for a small sweep, then for an H1 OB + FVG to form in your direction. Enter at that H1 OB, with a much shorter stop than entering straight at the H4 zone.
- Timing. For gold, the clearest pushes tend to come in the London and New York sessions. The video lectures include an example of an OB forming after a sweep of the Asian session low, near the New York open. This is practical experience, not a hard rule.
Example 1: Buying an OB + FVG on H4
Prices in both examples are illustrative, not actual market levels at the time you read this.
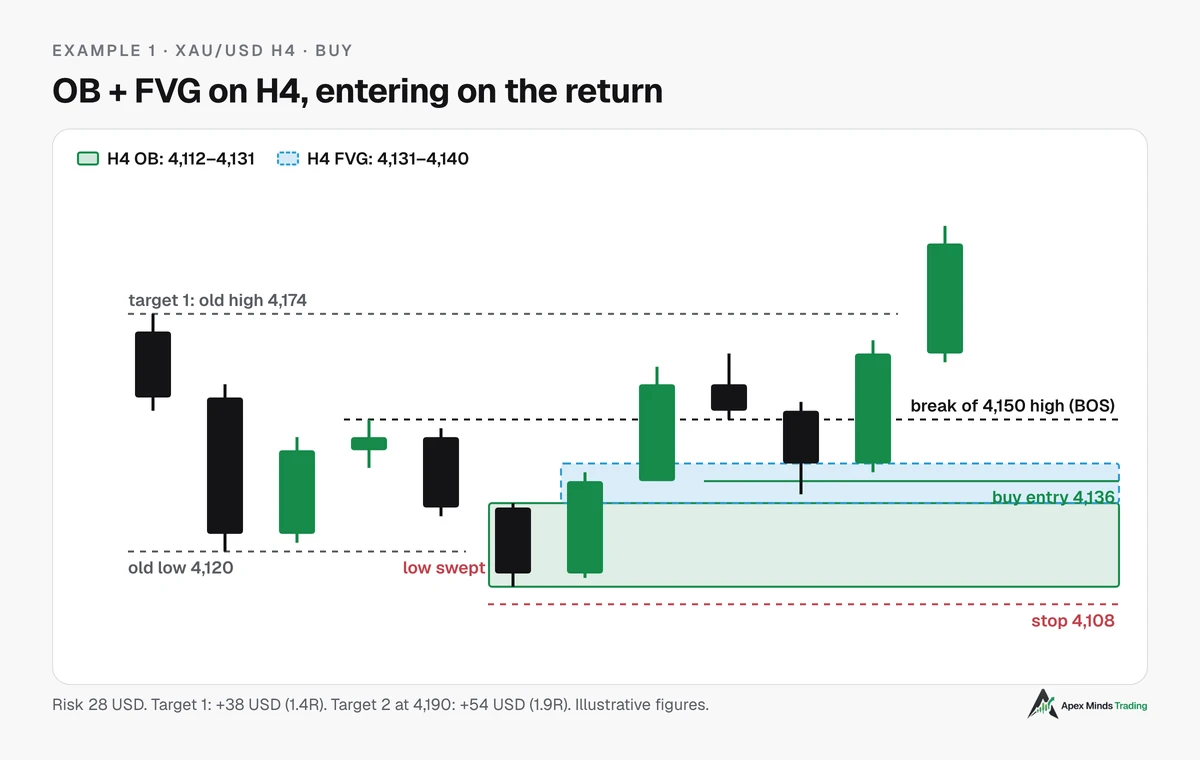
Context: D1 is in an uptrend. On H4, price is pulling back.
What happens:
- Price drops through the old low at 4,120, sweeping the stops below, down to 4,112.
- The last down candle (low 4,112, high 4,131) is the H4 OB: 4,112–4,131.
- Two strong up candles follow. The OB candle's high (4,131) and the third candle's low (4,140) don't touch, leaving the H4 FVG: 4,131–4,140.
- Price closes above the 4,150 high, breaking structure.
- Price pulls back into the FVG.
Scoring:
- Key higher-timeframe level (old low): met.
- Liquidity sweep: met.
- The push leaves an FVG: met.
- Structure breaks: met.
- Not yet touched: met.
- Discount zone: undetermined (depends on the H4 range).
- Aligned with D1 uptrend: met.
- Clear OB candle: met.
7 points, and 8 if price is in the lower half of the H4 range. That clears the threshold for a pending order.
Trade plan:
- Buy entry: 4,136, near the FVG's CE (4,135.5), above the OB.
- Stop loss: 4,108, below the OB low at 4,112, with a 4 USD buffer. Risk 28 USD/ounce.
- Target 1: 4,174, the old high, where buy-side liquidity sits. Profit 38 USD, or 1.4R.
- Target 2: 4,190. Profit 54 USD, or 1.9R. For a clean 2R, place it at 4,192. The extra 2 USD is only about 0.07R, but price has to travel a little further.
About the stop buffer. Don't add a fixed number by default. Leave exactly the spread plus the typical wick length on the timeframe you're trading, and measure it on your own broker. H4 needs a larger buffer than H1, and spreads widen around the New York open or on news. If you place the stop further than the buffer you actually need, R gets worse without improving your win rate, and your journal will record trades as "right" only because the stop was too wide. The 4 USD buffer in this example is an assumption, not a formula.
A tighter entry for day trading: when price touches 4,140, drop to H1 and wait for an H1 OB + FVG to form inside 4,131–4,140, then enter at the H1 OB with a stop below the H1 OB low. Risk often halves, at the cost of possibly missing the trade if price bounces straight away.
Example 2: Selling an OB + FVG on H1
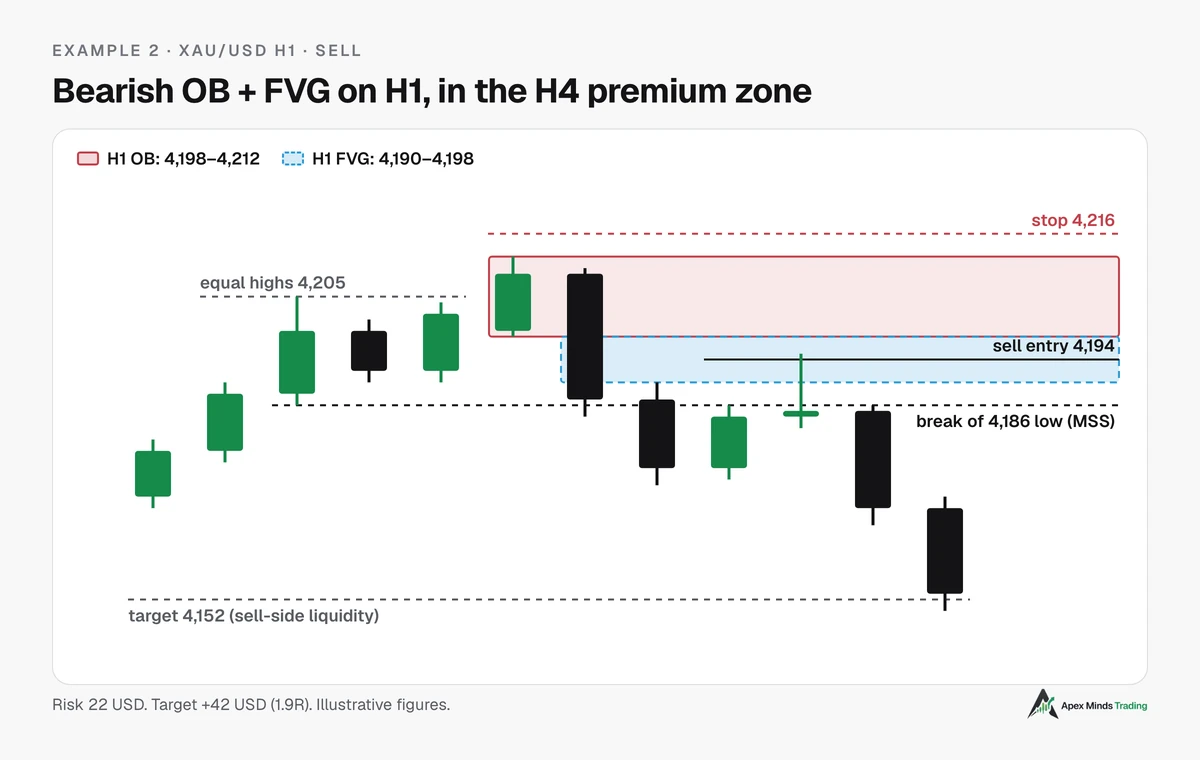
Context: on H4, price is in the upper half of the nearest range (premium), just below a bearish H4 FVG.
What happens on H1:
- Price makes two nearly equal highs around 4,205. Equal highs are where sellers' stop losses cluster.
- A long up candle closes above both highs and spikes to 4,212. This is the last up candle: H1 OB: 4,198–4,212 (body from 4,199 to 4,209).
- The next down candle closes below the OB low. The OB candle's low (4,198) and the third candle's high (4,190) don't touch, leaving the H1 FVG: 4,190–4,198.
- Price closes below the 4,186 low, shifting structure (MSS).
- Price pulls back up, touching the FVG's bottom edge and then its CE.
Scoring:
- Key higher-timeframe level (H4 FVG above, H4 premium): met.
- Liquidity sweep (equal highs): met.
- The push leaves an FVG: met.
- Structure shift (MSS): met.
- Not yet touched: met.
- Premium zone: met.
- Aligned with H4: met.
- Clear OB candle (10 USD body out of a 14 USD range, small wicks): met.
8 points. It's a perfect example, and precisely because it's perfect it teaches less than an example that slips on a criterion. When you journal, keep the low-scoring trades too, so you learn which criteria actually filter.
Three entries, in the order price reaches them on the way up:
- Bottom edge of the FVG (4,190): fills first and most easily, largest risk.
- FVG CE (4,194): balanced, and the entry used in the plan below.
- The OB's MT (about 4,204): fills last, shortest stop, may miss the trade.
Trade plan:
- Sell entry: 4,194, right at the FVG's CE.
- Stop loss: 4,216, above the OB high at 4,212, including a 4 USD buffer. Risk 22 USD/ounce.
- Target: 4,152, the old lows below, where sell-side liquidity sits. Profit 42 USD, or 1.9R.
What would make this trade wrong? If an H1 candle closes above about 4,204, beyond the MT of the OB body, the OB has weakened. If a candle closes above 4,212, close the trade and wait, because the zone may have turned into a breaker.
Both examples are illustrations built strictly by the rules, not real trades or trading signals.
Common mistakes
- Marking every opposite candle as an OB. No push and no break of structure means no OB.
- Trading an OB against the higher-timeframe trend just because it looks "nice".
- Entering an OB that's been touched many times, or redrawing the OB zone every time a wick pokes in so it fits.
- Placing the stop right at the OB's edge. Gold often sweeps a few dollars of wick. Leave a measured buffer, not one based on feel.
- Trusting OB indicators blindly. Indicators use their own mechanical rules and can't replace checking the context. The same indicator may draw OBs on candles in the middle of a range.
- Ignoring news. Before major US releases, an H1 OB can be pierced within minutes.
- Increasing size because of a high score. The score rates signal quality, not risk management.
In short
- An OB is the last opposite candle (or run of candles) before a strong push that changes structure. Apex calls it the launch pad.
- The FVG is the mark of the launch. An OB with the push's FVG is more reliable than an OB alone. Don't confuse that FVG with the imbalance inside the OB candle's body.
- Three must-haves: at a key level, a push that leaves an FVG, a break of structure.
- Five bonus points: liquidity swept, not yet touched, right premium/discount zone, aligned with the higher timeframe, a clear OB candle.
- Day trading gold: H4 gives the zone, H1 gives the entry; favour the London and New York sessions.
- Sources disagree on details. Pick one set of criteria, keep a journal, and test it on your own data.
How to test it on your own data: record the OB score at entry and the result for your first 30–50 trades. Then compare the win rate and expectancy in R of the 7–8 point group with the 5–6 point group. If the two groups don't differ, your filter isn't separating anything yet, and the criteria need adjusting before the scores do.
Related concepts
- FVG (Fair Value Gap): the skipped price zone.
- Breaker block: an OB that has been broken and flipped roles.
- Mitigation block, propulsion block: variants of the OB.
- Displacement: a strong move.
- BOS, MSS: break of structure and market structure shift.
- Premium and discount, PD Array.
- Liquidity: old highs and lows, equal highs, equal lows.
Trading gold and leveraged products carries a high level of risk and you can lose your capital. This article is for educational purposes only, is not investment advice and does not promise profits. Figures in the examples are illustrations.
