Breaker block: when an Order Block fails and flips roles
A breaker is an OB that gets swept for liquidity and then broken. Old resistance becomes new support. How to spot it, how it differs from a mitigation block, and the 5 states of a breaker on a gold chart.
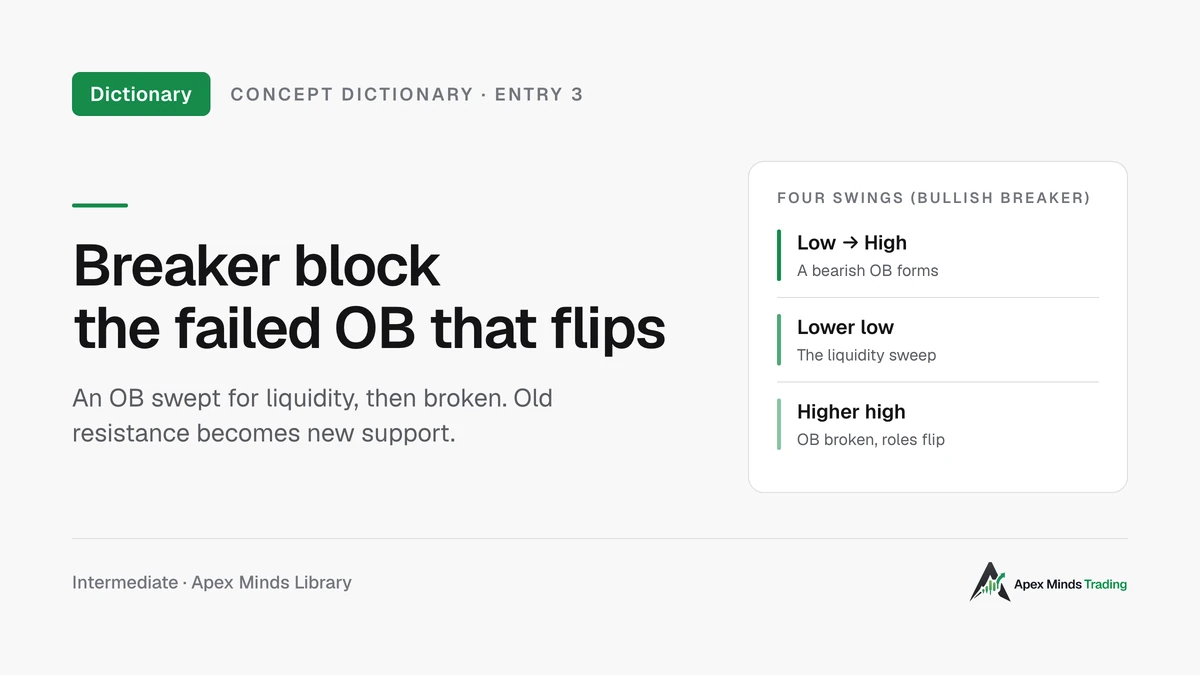
Concept Dictionary · Entry 3
Not every Order Block holds. Some OBs get sliced straight through. But an OB that is broken the right way doesn't disappear. It flips roles: the zone that used to stop price going up becomes a zone that supports price going up. That zone is called a breaker block.
This article reuses the Order Block (OB) and FVG definitions from the previous two entries. If you haven't read them, see What is an FVG and Order Blocks with FVGs.
What is a breaker block
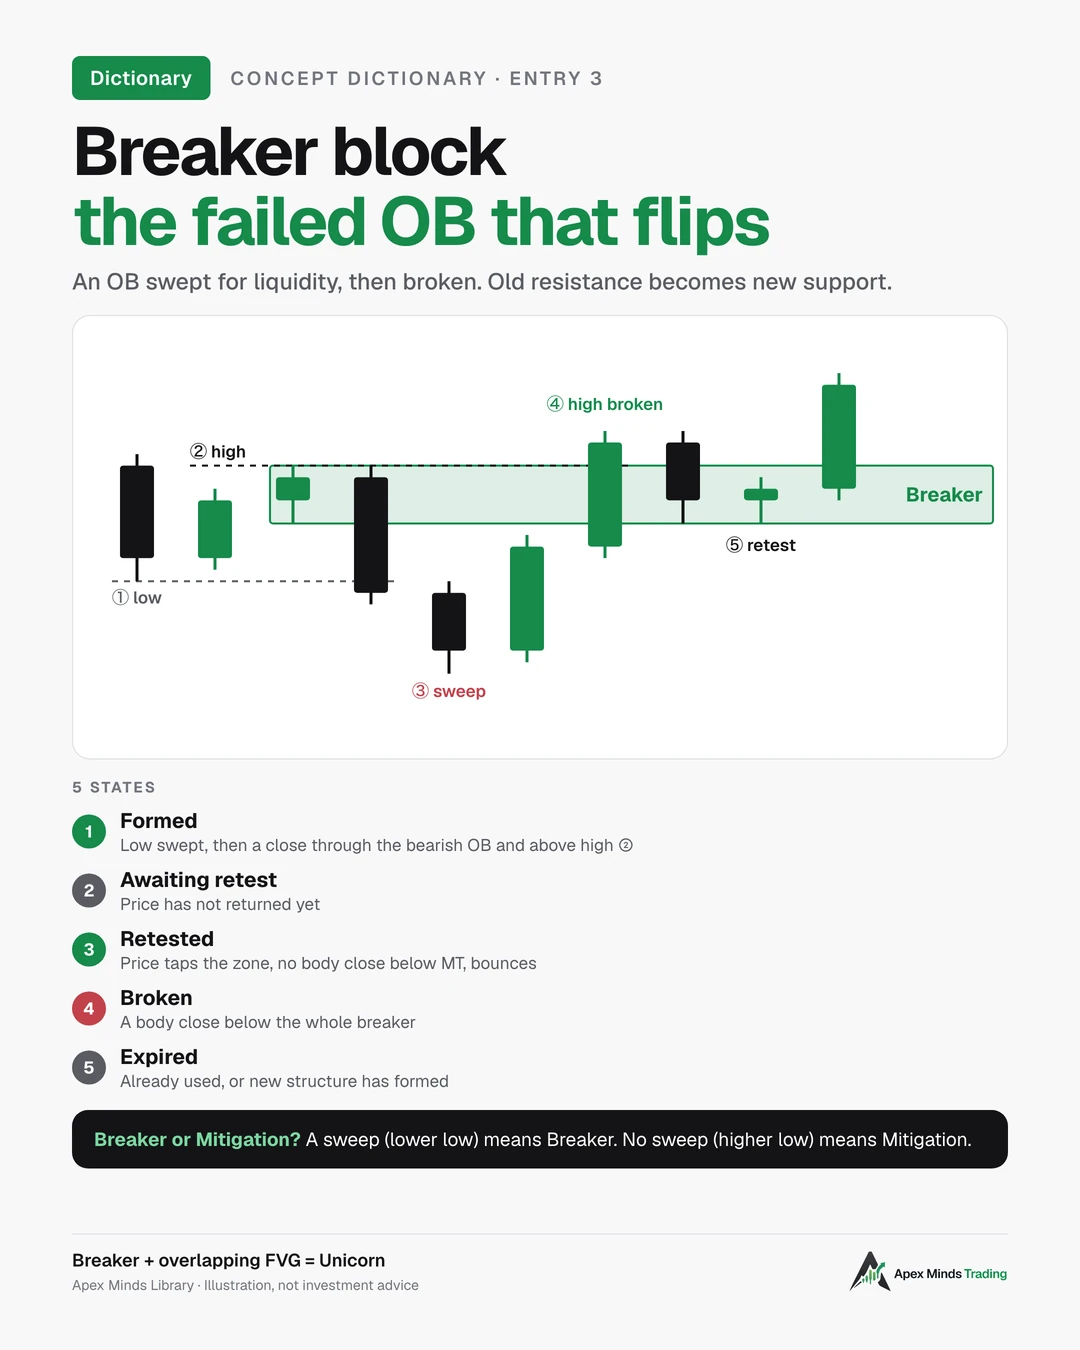
A breaker block is an OB that has failed after a liquidity sweep. Price sweeps an old high or low, then closes through the OB in the opposite direction. From that moment, the old OB zone flips roles.
- Bullish breaker: a bearish OB that has been broken. Former resistance becomes support.
- Bearish breaker: a bullish OB that has been broken. Former support becomes resistance.
Naming: a breaker is named after the direction price goes after it forms, not the colour of the old OB candle. A broken bearish OB creates a bullish breaker, because price then goes up. This is where beginners get confused most.
The practical ICT book defines a breaker as a failed OB, identified after a liquidity sweep or a market structure shift. It lists four conditions for a bullish breaker:
- A liquidity sweep.
- A valid bearish OB beforehand.
- Price closes above the high of that bearish OB.
- Market structure shifts upward.
A bearish breaker reads in mirror image: a liquidity sweep, a valid bullish OB, a close below the bullish OB's low, and a downward structure shift.
SMC material describes the same idea: a breaker appears after a previous OB is broken, price returns to test the broken zone, then continues in the new direction. According to this material, the broken OB shows that large money has abandoned the old level and is driving price in a new trend.
The four swings of a breaker
The ICT video lectures give the easiest way to spot it: count four swings. A swing is a clear high or low on the chart.
A bullish breaker needs all four, in order:
- Low.
- High.
- Lower low than low 1. This is the liquidity sweep.
- Higher high than high 2, with a candle closing above high 2. This is when the bearish OB is broken and structure shifts. A wick poking through doesn't count.
The breaker zone is the up candle (or run of up candles) between low 1 and high 2. That is the old bearish OB: the last up candles before price dropped to make low 3.
A bearish breaker reads the other way: high, low, higher high (the sweep), then a lower low with a candle closing below low 2.
Without point 3, meaning no sweep, it is not a breaker. The lectures include an example that looked very much like a breaker but price never made a lower low, and the author ruled it out.
Two quantitative conditions the sources don't give
These are the two biggest gaps when applying breakers to real charts. None of the sources read gives a number. Below are conventions for this series, not ICT's, and they have not been tested on data. Treat them as a starting point for your own testing.
Sweep depth. A 2 USD poke below an old low means nothing. A 200 USD move is already a new downtrend, not a sweep. Working rule: compare the sweep depth (how far price goes beyond low 1) with the height of the leg from point 1 up to point 2. Count it as a sweep when the depth is 25% to 100% of that height. Under 25% is noise. Over 100%, re-read the whole structure and don't trade it as a breaker.
Time to form. A breaker that forms within 3 candles is very different from one that forms after 30 candles of sideways action. Working rule: point 4 must arrive within no more candles than the leg from point 2 down to point 3, and no more than 8 H1 candles. If price ranges too long before breaking, the pattern has lost its reference value. It's then a fresh breakout, not a breaker.
Why the old zone flips
The common explanation: traders who sold at the bearish OB are trapped when price turns against them. When price comes back to exactly where they entered, many want out at breakeven. A seller's exit is a buy order, so the zone supports price. Meanwhile, buyers who won the breakout wait there to add.
This is an explanation, not something you can verify. Know the flip side too: if this mechanism were fully true, breakers would never fail, yet they fail often. A common reason is that the breakeven exits are outweighed by fresh orders the other way, and once that pressure is gone, the zone stops working.
What you can verify is how price behaves when it returns to the breaker.
Marking the breaker zone
Sources don't fully agree here:
- The practical ICT book: you can take the whole run of same-colour candles before that high, but the last candle is the most sensitive. For precision, the founder of ICT mostly uses only the last candle.
- The ICT video lectures: some take the whole run including wicks, some use bodies only, some use wick-to-close when a candle has a long wick.
The convention in this series (same as the Order Block entry):
- Mark the last candle before the swing that gets broken.
- Full zone (including wicks): for checking whether the breaker is still valid or has been broken.
- Body and MT (mean threshold, the 50% level of the body): for entries and as a confirmation marker.
No marking method is absolutely right. Pick one, record it in your journal, and keep it so results stay comparable.
Breakers with FVGs
The ICT video lectures want a breaker paired with displacement, meaning a break strong enough to leave an FVG.
The reason is the same as for OBs: the FVG is evidence the break had real force. A break that leaves a gap between candle 1 and candle 3 is genuinely imbalanced. A drift higher with overlapping wicks proves nothing.
Where the FVG sits relative to the breaker. The push at point 4 starts from the sweep low, below the breaker. So the push's FVG can sit inside the breaker, partly overlap it, or sit entirely above it, depending on where the push leaves its gap on the way up. When the breaker and FVG overlap, that is the tightest entry zone the pattern offers. When the FVG sits entirely above, a sensible entry is the breaker candle's open or MT, not the FVG edge.
Some ICT lectures call the breaker-plus-overlapping-FVG combination a unicorn. The name doesn't appear in the practical ICT book or the SMC material read, so this series only uses it as a common nickname. What matters more than the name: a breaker with an FVG, the two zones overlapping.
The five states of a breaker
A breaker passes through five states. Each has its own signs on the chart, so you know where the zone stands the moment you look.
1. Formed.
- Signs: all four swings are in place. Price sweeps the old low, then a candle closes above the bearish OB's high and beyond high 2.
- Ideally: the break comes with displacement (a strong move) and leaves an FVG.
- This is when you mark the breaker zone and work out your entry and stop in advance.
2. Awaiting retest.
- Signs: price has moved up away from the zone and hasn't come back.
- The breaker is still fresh and at its most valuable.
3. Retested (respected).
- Signs: price pulls back and taps the breaker. Wicks may dig deep, but no candle body closes below the MT, and price bounces.
- This is the time to enter.
4. Broken.
- Signs: a candle closes below the bottom of the breaker zone.
- The breaker has failed. Exit if you're in. A body close below the MT that hasn't broken the bottom of the zone is a warning, not yet a failure.
5. Expired.
- Signs: the breaker has been used once and price has moved far away; or new structure has formed above; or the breaker has been broken; or it is simply too old.
- Don't enter at this zone any more.
On the zone's age. The sources only talk about price, not the age of a zone. This series' convention for gold: an H1 breaker that hasn't been retested within two trading sessions gets re-scored from scratch, because the structure around it has changed. Give an H4 breaker three to four days. These are working markers; adjust them to your data.
Managing the trade after entry
The previous entry stopped at the entry point. Breakers need this extra section because they have five states, and knowing which state the zone is in is exactly what trade management is for. The points below are this series' trade-management conventions; test them in your journal.
- Price reaches 1R: move the stop to the entry price. From here the trade can no longer lose money, and you don't have to decide on feel. In exchange, some trades that would have won get closed at breakeven on a deep pullback, so the system's expectancy may change. Compare both approaches in your journal.
- Price taps the breaker a second time: don't add. A second retest is usually less reliable than the first, and adding there doubles your risk on a weakening signal.
- Price enters the zone and then ranges for many candles: leave the stop alone, don't widen it. If the waiting time exceeds the zone-age marker above, treat the breaker as expired and close the trade according to plan.
- An opposite breaker forms: close the old trade first. Don't hold two opposing trades. In essence, the market just told you the structure has changed.
- Never move the stop further than its original level, under any circumstances. This is the fastest way to damage an account when trading gold.
Telling breakers apart from similar concepts
Breaker vs Order Block.
- An OB is where the push started, supporting price in the push's direction. A bullish OB supports price going up.
- A breaker is an opposite OB that has failed. A bullish breaker is an old bearish OB that now supports price going up.
Both support price. The reason differs: an OB holds because the original orders are still there; a breaker holds because the zone flipped roles after a successful sweep.
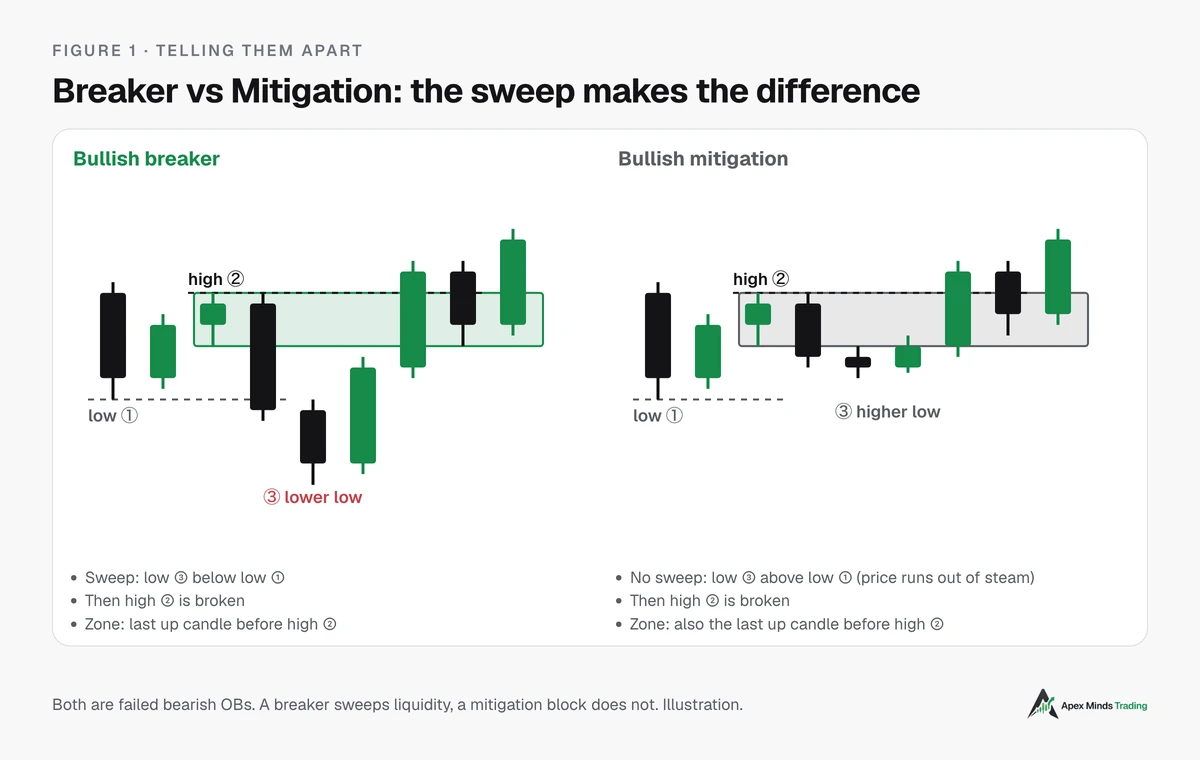
Breaker vs Mitigation block. This is the most confusing pair. Both are failed OBs that flip roles. The difference is the sweep (see Figure 1):
- Bullish breaker: low → high → lower low → higher high. There is a sweep.
- Bullish mitigation: low → high → higher low → higher high. No sweep. Price runs out of steam, can't reach the old low, and turns.
The video lectures say it plainly: a breaker must sweep the previous swing, while a mitigation block only needs price to fail to make a new high or low. The practical ICT book likewise describes mitigation as a reversal pattern where price fails to make a higher high or a lower low. Mitigation gets its own entry (Entry 4).
Breaker vs Inverse FVG. The two share the same spirit: a broken zone flips roles. An inverse FVG is an FVG that price closes through. A breaker is an OB that price closes through, and it needs a sweep first. The most memorable difference: a breaker needs a sweep, an inverse FVG does not.
Example: a bullish breaker on XAU/USD H1
Illustrative figures, not actual prices at the time you read this.
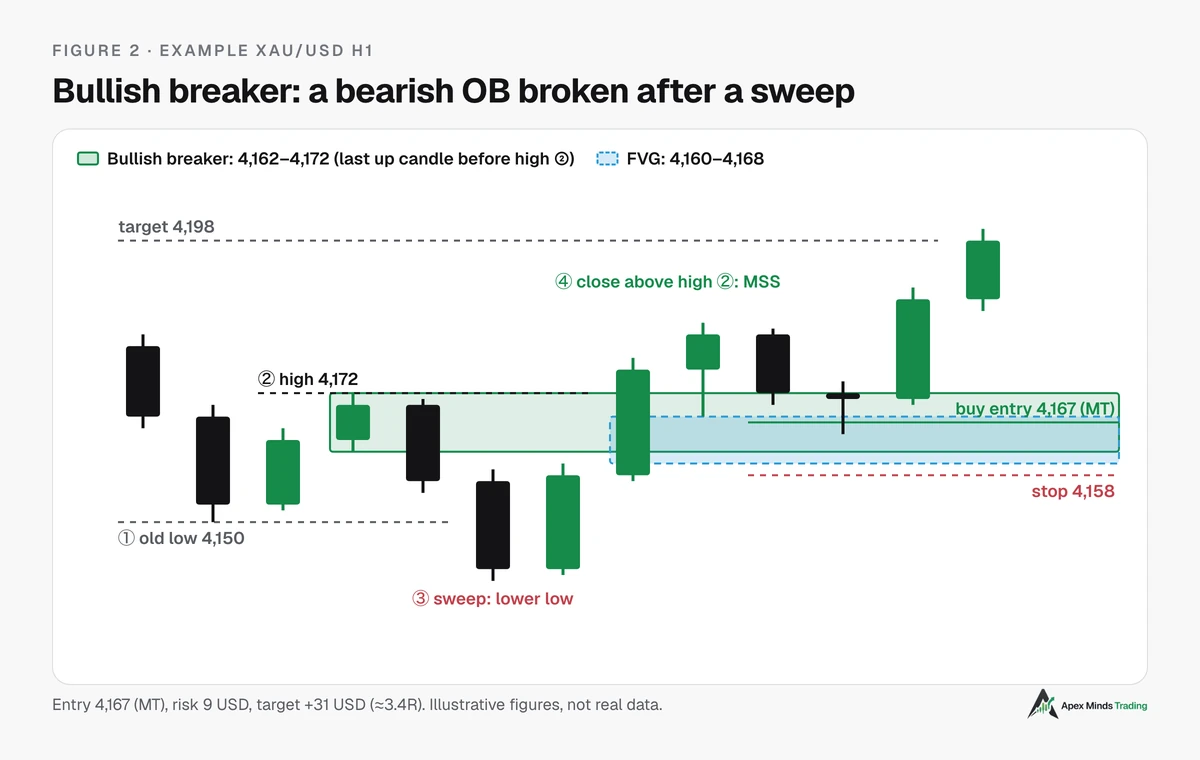
Context: price is in a down leg on H1, with no bullish structure nearby.
What happens:
- Price makes a low at 4,150 (point 1).
- Two up candles push price to a high at 4,172 (point 2). The last up candle has a low of 4,162, a high of 4,172, and a body from 4,164 to 4,170. This is the bearish OB.
- Price drops hard from there to 4,140, sweeping the 4,150 low (point 3). The sweep is 10 USD deep. The leg from point 1 to point 2 is 22 USD tall, so the sweep depth is about 45%, within 25%–100%, so it counts.
- Two strong up candles push price higher, and the second one closes at 4,176, above the 4,172 high. The bearish OB is broken and structure shifts up (point 4). The 2→3 leg took 2 candles and point 4 also arrived 2 candles later, meeting the time convention. A bullish breaker forms: zone 4,162–4,172, MT about 4,167.
- The push at point 4 leaves an FVG at 4,160–4,168, overlapping the breaker at 4,162–4,168. This is the overlapping case, the tightest entry zone.
State at entry: price pulls back, a wick dips to 4,165, and the body closes at 4,171, above the MT. The breaker has been retested.
Trade plan:
- Buy entry: 4,167, at the breaker's MT, inside the breaker/FVG overlap.
- Stop loss: 4,158, below the breaker low at 4,162, with a 4 USD buffer. That buffer is an assumption. Measure the spread and typical H1 wick length on your own broker to choose your number.
- Risk: 9 USD/ounce.
- Target: 4,198, an old high on a higher timeframe above (illustrative). Profit 31 USD, about 3.4R.
Choosing where to put the stop. The lectures have no hard rule, and the two options below trade off differently:
- Below the breaker (as above): about 3.4R, but more likely to be swept because the stop sits right next to a zone many traders are watching.
- Below the 4,140 sweep low (e.g. 4,136): much harder to sweep, but risk becomes 31 USD and the reward-to-risk drops to about 1R.
Neither is better in absolute terms. The first has a nice R but a lower win rate. The second has a higher win rate but each winner only covers one loser. Their expectancy may be the same. Only your journal can tell which suits you.
What would make this trade wrong, or worth skipping?
- An H1 body closes below 4,167 (MT): warning. Don't add; get ready to exit.
- A close below 4,162: the breaker is broken. Exit.
- Price runs straight above 4,178 without any pullback to the zone: skip the trade. Chasing after price has covered most of the distance to the target leaves no reward-to-risk.
Using breakers when day trading gold
- H4 gives the zone, H1 gives the breaker. When price enters a key H4 zone (FVG, OB, old high or low) and sweeps liquidity there, wait for an H1 breaker to confirm price has turned.
- Favour breakers with an FVG. Breakers without a strong push are easily broken on the first retest.
- Only use the first retest. A breaker touched many times loses value, just like an OB.
- Favour the London and New York sessions. In practice, sweeps and breaks in these two sessions tend to be clearer and more reliable than those during thin liquidity.
Common mistakes
- Calling every broken OB a breaker. No sweep (lower low or higher high) means it's a mitigation block, or just a broken zone.
- Entering before the breaker has fully formed. Wait for a candle to close beyond high 2, not just a wick poking through.
- Marking a long run of candles as the breaker and entering at the far edge. A zone that's too wide inflates risk and turns a good trade into a bad one.
- Holding the trade after a body closes below the breaker because "it's just a sweep".
- Ignoring the zone's age. An H1 breaker formed three days ago isn't worth the same as one formed this morning.
- Ignoring news. Before major US releases, an H1 breaker can be pierced within minutes. This is a common scenario on gold, and it's also when traders misread a news-driven break as "an ordinary failed breaker".
Test it on your own data
Breakers are among the easiest ICT concepts to fool yourself with, because looking back at old charts you'll see a beautiful breaker everywhere. How to avoid that:
- Screenshot the breaker when it forms, not after price has run. The screenshot proves you saw it beforehand.
- Record three things: the planned entry, the closing price of the confirmation candle, and the number of candles from point 4 to the first retest.
- Log results in three groups: breakers with an FVG, breakers without an FVG, and breakers broken on the first retest.
- After 30 samples, compare group 1 with group 2. If they don't differ, the FVG adds nothing under your conditions, and you should drop that criterion rather than believe in it.
In short
- A breaker block is an OB that failed after a liquidity sweep, then flipped roles: resistance into support, or the reverse.
- A breaker's name follows the direction price goes after it forms, not the colour of the old OB candle.
- Spot it with four swings: low, high, lower low (sweep), higher high with a candle close.
- The breaker zone is the last candle before the high that gets broken. Use the full zone to check validity, the body and MT for entries.
- A sweep means breaker; no sweep means mitigation.
- Five states: formed, awaiting retest, retested, broken, expired.
- A breaker with an FVG is more reliable. The FVG can sit inside, overlap, or sit above the breaker. If they overlap, enter there; if not, enter at the breaker candle's MT or open.
Related concepts in the Dictionary
- What is an FVG (Entry 1): the skipped price zone, the trace of a push. A good breaker usually comes with an FVG.
- Order Blocks with FVGs (Entry 2): what an OB is, why an OB with an FVG is more reliable, and the criteria for filtering OBs on H1 and H4.
- Mitigation block, propulsion block (Entry 4): variants of the OB. Mitigation is the closest pattern to a breaker in shape; the only difference is at point 3.
- Displacement (Entry 5): the strong move that leaves an FVG. No displacement, no reliable breaker.
- BOS, MSS (Entry 6): break of structure and market structure shift. This is point 4 of the four-swing pattern.
- Premium and discount, PD Array (Entry 7): a breaker is one element of the PD Array, and its position in the range decides whether to take it or skip it.
- Liquidity (Entry 8): the old low swept at point 3. Understanding liquidity explains why the sweep must come before a breaker forms.
References
- Practical ICT book: chapters on breaker blocks and mitigation blocks.
- SMC material: chapter on order block types.
- ICT video lectures in Apex's reference library (breaker blocks, mitigation blocks, breakers paired with FVGs).
This article is for educational purposes only, is not investment advice and does not promise profits. Trading gold and leveraged products carries a high level of risk and you can lose your capital. Figures in the examples are illustrations.
