Multi-timeframe analysis: from big picture to entry
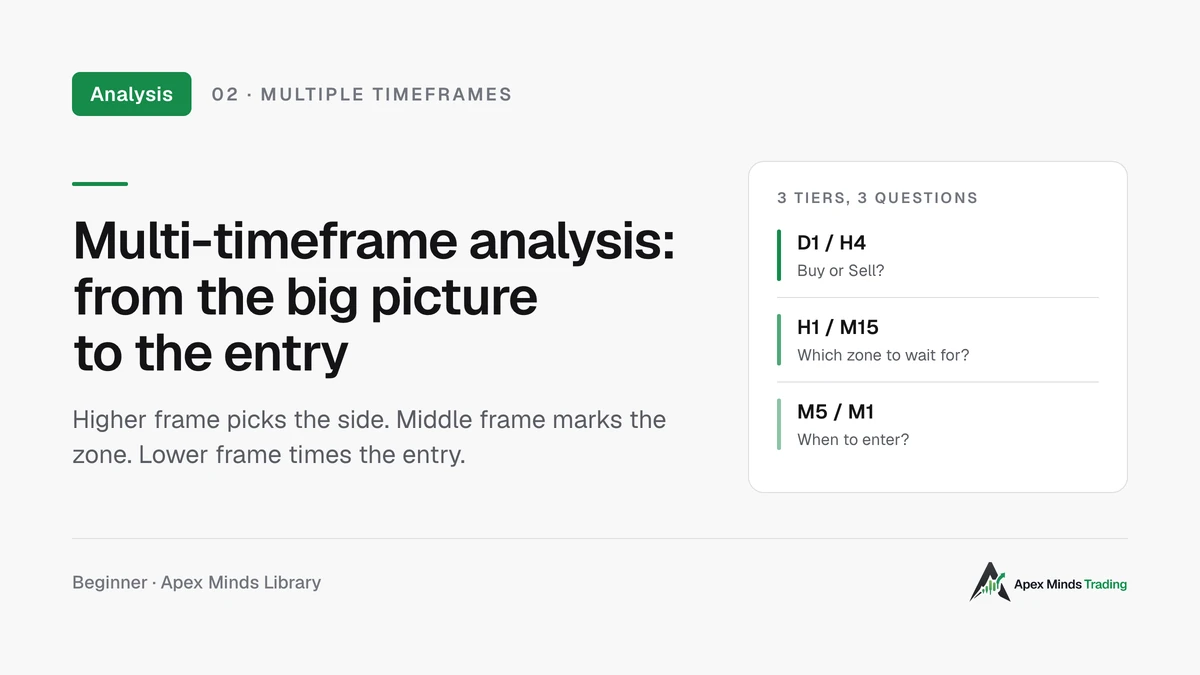
Higher frames tell you Buy or Sell. Mid frames mark wait zones. Lower frames time the entry.
Many new traders open the M1 chart, see a few green candles and hit Buy. Ten minutes later price turns and hits their stop. Only then do they look at the daily chart and see a clear downtrend, where the rally on M1 was just a small pullback.
The mistake here isn't bad analysis. It is asking the wrong question on the wrong timeframe. Multi-timeframe analysis fixes exactly that: each timeframe answers its own question.
- Higher timeframe (HTF): should I buy or sell?
- Intermediate timeframe (ITF): which price zone should I wait for?
- Lower timeframe (LTF): when do I enter, and where is my stop?
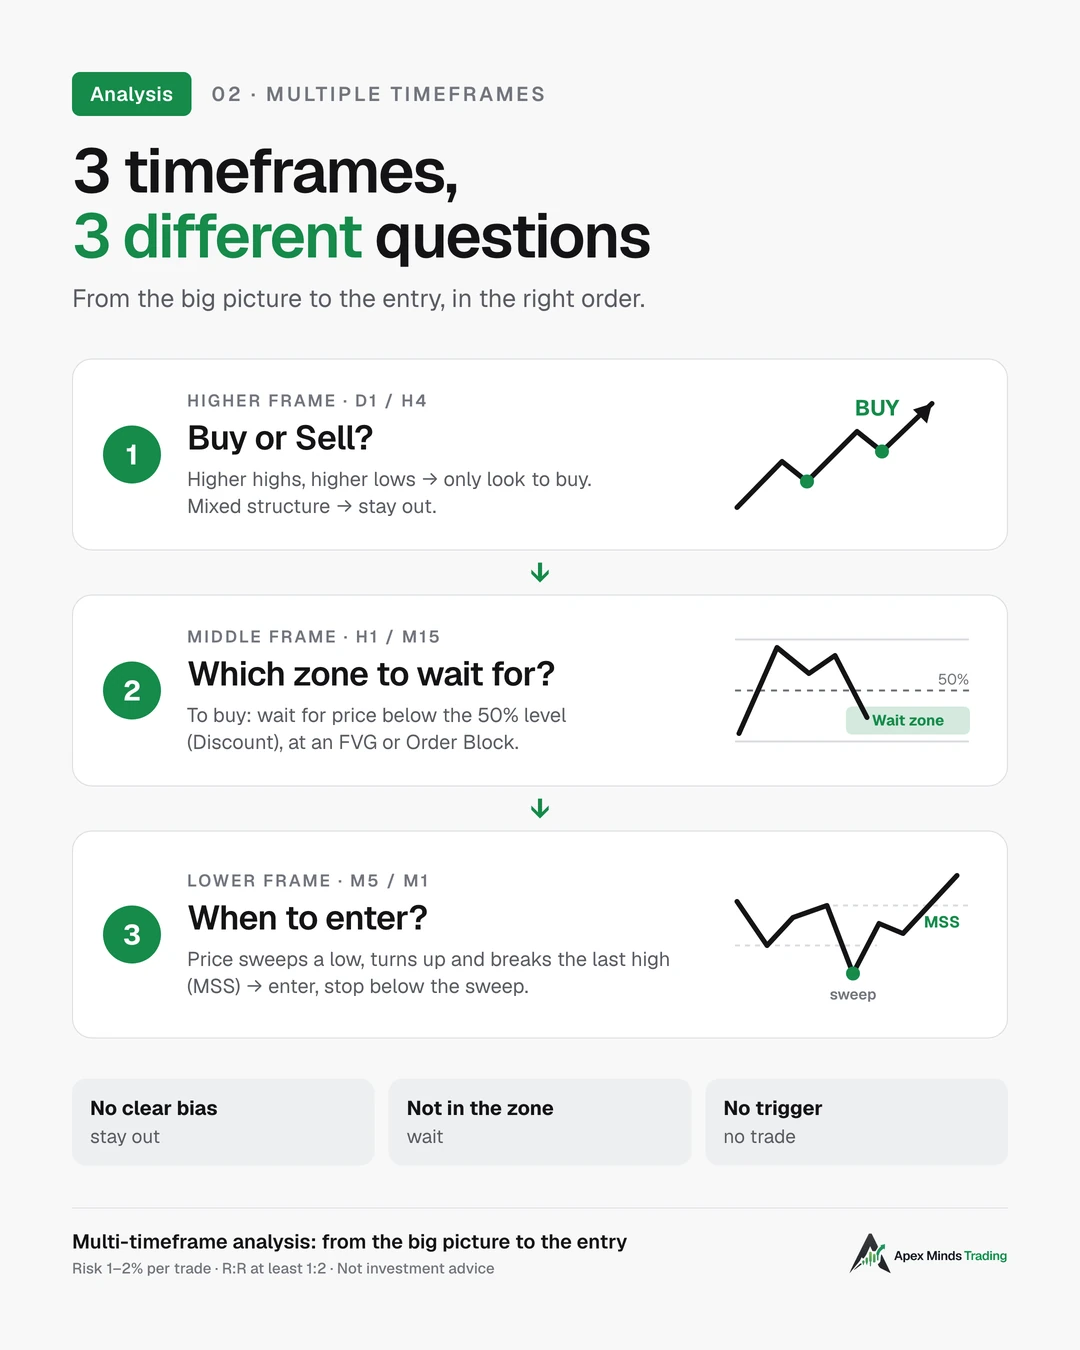
Answer these three questions in order and you stop chasing price, stop selling the lows, and know exactly what you are waiting for on the chart.
The root idea: the market always moves on three levels at once
More than a century ago, Charles Dow observed that the market always has three movements going on at the same time. Robert Rhea summarised them in The Dow Theory:
- Primary trend: the big move up or down, usually lasting a year or more.
- Secondary reaction: a significant decline in a bull market, or a rally in a bear market. It usually lasts from three weeks to a few months and retraces about 33% to 66% of the preceding primary move.
- Daily fluctuations: small, noisy day-to-day moves.
Picture the tide: as the tide comes in, each wave still pulls back, but every new wave reaches higher up the beach.
In trading terms, these three movements are your three timeframe tiers: the primary trend gives you direction, the reaction is the zone to wait for, and the small fluctuations are where you time the entry. For day trading you shrink the same structure down to D1, H1 and M5: D1 is the tide, H1 is each wave, M5 is the ripples on the surface. Buy while the tide is coming in, wait for a wave to pull back, then enter as the small ripples start turning up.
Why does one structure work on every timeframe?
Bob Volman, author of Understanding Price Action, explains that price action principles can be applied to any timeframe, because they all come from the same laws of supply and demand. You only need small adjustments for each timeframe's typical range.
In practice this means highs, lows, trends, pullbacks and consolidations look the same on D1 as on M5, just at a different size. You learn one set of concepts and use it on all three tiers instead of learning three separate methods.
Tier 1 – Higher timeframe (D1/H4): choose Buy or Sell
The first job every day is to answer: should I favour buying or selling today?
ICT (Inner Circle Trader, the method taught by Michael J. Huddleston) calls this answer the Daily Bias: the anticipated direction of price for the day. According to Practical ICT Strategies, you find it by opening the daily chart (D1) and looking for the most recent Market Structure Shift (MSS).
- If price recently broke above an important high and the structure shifted to the buy side, the Daily Bias is bullish: today you only look to buy.
- If price recently broke below an important low, the Daily Bias is bearish: today you only look to sell.
The simplest way to read structure: an uptrend is a series of Higher Highs and Higher Lows; a downtrend is a series of Lower Highs and Lower Lows. When highs and lows are mixed and follow no sequence, that is the time to stay out.
What if the lower timeframe says buy while the higher timeframe is falling? Adam Grimes, in The Art and Science of Trading, points out that if you always skip trades against the higher timeframe, you will never catch the moments when the higher timeframe turns. He suggests a few ways to handle it: skip the trade, or take it but tighten stops sooner and take profits faster. What matters is deciding in advance in your plan, not while staring at the chart.
For beginners, the simplest and safest approach is: only trade with the Daily Bias, and stay out when the higher timeframe is unclear. Once you have experience and your own data, you can add other ways of handling these conflicts.
Tier 2 – Intermediate timeframe (H1/M15): wait at the right price
Knowing the direction doesn't mean entering right away. Chasing price after it has already run is the fastest way to buy the top of a pullback.
Following ICT's Daily Bias guidance, when the bias is bullish:
- Find the Discount zone.
- Wait for price to return to a PD Array inside that discount zone.
- While price pulls back, the structure must not shift to the sell side. If it does, the bullish bias is no longer valid.
Terms you need:
- Dealing Range: the price range between the most recent high and low you are looking at.
- Premium / Discount: split the dealing range at the 50% level, called equilibrium. The upper half is Premium, the lower half is Discount. The quickest way: draw a Fibonacci from the low to the high of the range, using just three levels, 1 – 0.5 – 0. The 0.5 level (50%) is equilibrium.
- PD Array (Premium & Discount Array): the types of price zones used to look for entries, for example:
- Fair Value Gap (FVG): a gap left behind when one candle moves so strongly that the wicks of the candles before and after it don't overlap. Price often comes back to "fill" this zone.
- Order Block (OB): the last opposite-coloured candle right before a strong push. In an uptrend, it is the last down candle before the move up.
The logic is simple: in an uptrend, wait to buy in the cheap part of the pullback, not the expensive part. It also matches how Dow described reactions: they usually retrace one third to two thirds of the primary move before the trend continues. The Discount zone below 50% is where pullbacks often end.
Volman adds another way to look at the wait zone. A breakout is much more likely to follow through when price has first formed a buildup: a tight cluster of sideways candles right against the barrier. He distinguishes two kinds of breakout:
- Tease break: a hasty break with no buildup before it, very likely to fail. Best skipped.
- Proper break: a break that comes straight out of a tight buildup right against the barrier. This is the kind worth trading.
The line between the two can be thin at times, so this is a skill you train by looking at many charts. A practical tip: ask yourself "before this break, did price compress right against the level?". If not, it is most likely a tease break.
Tier 3 – Lower timeframe (M5/M1): time the entry
Once price is in the right zone, the lower timeframe lets you enter with a tight stop, which gives you a better reward-to-risk ratio (R:R). The lower timeframe is not for guessing the day's direction; you already have that from tier 1.
The ICT way. In the ICT 2024 Mentorship, Michael advises newcomers to focus on just three timeframes: 15 minutes, 5 minutes and 1 minute, with M15 as the bias chart. The entry sequence on the lower timeframe:
- Wait for price to run through relatively equal highs (or lows). This is a Liquidity Sweep: price runs through the area where many stops sit, then comes back.
- Wait for price to return and close beyond the nearest high/low in the opposite direction. That is the MSS on the lower timeframe, a sign the other side is running out of steam.
- Enter when price pulls back into the Order Block or FVG that just formed, targeting the next pool of liquidity.
You will meet different timeframe sets within ICT: one model uses D1 as the bias chart and looks for confirmation on M15 or higher; another uses M15 as the bias chart and M1 for entries. The higher the confirmation timeframe, the more reliable the signal, but the wider the stop. Pick one set and stay consistent instead of switching every day.
The Grimes way. Grimes uses a lower timeframe breakout as the entry, as simple as buying a break above the previous bar's high. Another option is trading around previous lower timeframe pivots, for example a failure test (price breaks a level, can't hold it, and comes back). In his view, this is where multiple timeframe influences come together most powerfully.
The Volman way. Why is the bounce after a sweep so strong? Volman calls it double pressure. If you want to buy, price needs help from both sides to travel far: buyers opening new positions, and trapped sellers forced to buy back to get out. The sweep below the low pulls more sellers into the trap; when price turns up, they have to buy back, adding fuel to the move.
The daily 3-step process
Step 1 – D1/H4: check the compass
- Is price making higher or lower highs and lows? Which side was the latest MSS on D1?
- Conclude one of three: only look to buy, only look to sell, or stay out if structure is mixed.
- Mark the major support and resistance zones. Don't buy right under major D1 resistance, don't sell right above major support.
Step 2 – H1/M15: read the map
- Find the most recent dealing range and mark the 50% level.
- To buy, only look for FVGs/Order Blocks below 50% (Discount). To sell, look above 50% (Premium).
- Wait until price reaches that zone. If price isn't there yet, there is nothing to do.
Step 3 – M5/M1: pull the trigger
- When price reaches the zone, wait for a liquidity sweep of the nearest low (or high) on the lower timeframe.
- Wait for an MSS: a candle closing decisively beyond the nearest high (or low) in the direction of the Daily Bias.
- Enter when price pulls back into the FVG or Order Block that just formed on the lower timeframe.
- Stop loss: beyond the wick of the sweep candle or beyond the buildup, plus a small buffer for noise and spread widening.
- Take profit: before the opposing liquidity, or an untouched high/low on the middle or higher timeframe.
Example: one XAU/USD trading day in 3 tiers
An illustration of how the steps connect:
- Morning, open D1. Yesterday gold closed above last week's high, and the recent lows are rising. Daily Bias: bullish. Today you only look to buy.
- Open H1. The latest up-leg runs from the Asian session low to the London session high. Draw the Fibonacci; the 50% level sits mid-leg. Just below 50% there is an H1 FVG. That is the wait zone. Price is still above it, so do nothing yet.
- Early New York session. Price pulls back and touches the H1 FVG. Only now do you drop to M5.
- On M5. Price dips slightly below the nearest low, sweeping the stops of early buyers, then bounces with a strong candle that closes above the nearest high. That is the MSS.
- Enter. Place a buy as price pulls back into the small FVG just created on M5. Stop below the sweep wick plus a small buffer. Take profit before the London high on H1.
- Check before clicking. Is R:R at least 1:2? No major news in the next 30 minutes? Size based on 1% of the account? If all yes, click.
If at step 3 price never reaches the wait zone and runs straight up, you have no trade that day, and that is the right outcome.
Checklist before you click
Only enter when the answer to all five is "yes":
- Is the Daily Bias on D1/H4 clear? If not, stay out.
- Is price in the right zone (Discount to buy, Premium to sell) on the middle timeframe? Don't enter while price floats in the middle of the range.
- Has the lower timeframe printed a liquidity sweep and an MSS?
- Is the R:R at least 1:2?
- Is major economic news coming up (NFP, CPI, FOMC)? If so, stay out.
Risk management: the part you can't skip
A great entry doesn't replace money management:
- Risk only 1–2% of the account per trade. For position sizing, see Capital management: protect the account first, grow later.
- Never average down.
- Know when to exit manually. Volman describes three situations where you exit before your stop or target is hit:
- News Report Exit: on major news, price can spike hard and go completely against the earlier trend. With news coming up you have three choices: stay in, reduce size, or get out. For beginners the safest choice is not to open new trades before major news and to close open trades before the release.
- Resistance Exit: price approaches a barrier before reaching the target and starts to stall.
- Reversal Exit: a clear reversal develops against your trade.
In short
- The higher timeframe answers "buy or sell". The middle timeframe answers "where to wait". The lower timeframe answers "when to enter".
- The market always moves on three levels at once, like the tide, the waves and the ripples. The same structure repeats on every timeframe.
- ICT, Grimes and Volman are different ways to execute the same idea. None guarantees winning every trade; they help you enter where you have more of an edge, with risk under control.
- Pick one set of timeframes (for example D1 – H1 – M5), stay consistent, and practise on a demo account first.
A losing streak can still happen even when you follow every step. Read Think in probabilities, not each trade to stay on process through those periods.
References
- Robert Rhea, The Dow Theory, Chapter VI "Dow's Three Movements".
- Practical ICT Strategies (6th Edition), sections "Daily Bias", "PD-Array", "Premium & Discount" and "ICT 2024 Mentorship".
- Adam Grimes, The Art and Science of Trading, reading "Hidden in Plain Sight: Trading Multiple Timeframe Influences" and the Pullback chapter.
- Bob Volman, Understanding Price Action, introduction, Chapter 2 "Price Action Principles – Theory" and Chapter 6 "Manual Exits".
The XAU/USD example is an illustration. The methods in this article are how these authors teach, not formulas that guarantee profit. This article is not investment advice.
